
Sabermetrics 101
A high-level overview of sabermetrics and their purpose in modern professional baseball

Personal Background
Welcome! I’m Peter, and this is my first blog post. I’ll be using this space to explore topics that interest me in the world of sports analytics and data visualization.
A bit about me: I hold a bachelor’s degree in Finance and Business Analytics from Indiana University, which gave me a solid foundation in statistical methods and data analysis. Professionally, I work as a healthcare consulting analyst, where I analyze data for clients.
To be clear, I’m not an expert—just someone who enjoys digging into numbers and sharing ideas. This blog is a fun outlet for my curiosity and a space to generate discussion around the topics I care about. Much of the inspiration for this and future posts comes from the excellent work done by organizations like SABR, FanGraphs, and Baseball Reference.
Level 1: The Basics
Baseball statistics come in two flavors: counting stats (totals over time) and rate stats (percentages or averages). I’ll classify “level 1” statistics as the ones you see during broadcasts—simple, clear, and widely used. These basic statistics are helpful for their simplicity and unambiguous nature. The downside is that they are not great predictors of future performance.
Counting
Home Runs
Hits
Strikeouts
RBIs
Rate
Batting Average
On Base Percentage (OBP)
Slugging Percentage (bases per at-bat)
WHIP (Walks plus Hits per Inning Pitched)
My Personal Favorite: On-base percentage. If you want to know why, read Moneyball.
Level 2: Intermediate Statistics
We are slowly moving away from traditional statistics towards ones that are more likely to be used in a front office setting. These still involve basic math, but better portray what is deemed valuable in the modern game.
OPS (On-base Plus Slugging): Measures a player’s ability to get on base and hit for power
ISO (Isolated Power): Slugging minus batting average—shows how many extra bases a hitter gets per at-bat
BABIP (Batting Average on Balls In Play): Helps determine if a player is performing well or just benefiting from luck over a given time frame
wOBA (Weighted On-Base Average): Like OBP, but smarter. Different events (walks, singles, homers) are weighted based on actual run value
My favorite: OPS, as it measures both the power and batting eye of a player in a simple manner.
Level 3: League and Park Adjusted Statistics
A distinguishing factor of America’s pastime is that field dimensions are not standardized, which accommodates historic oddities such as Fenway Park, but also allows for modern adjustments like “Walltimore” at Camden Yards. This quirk makes comparing players in different divisions and teams difficult, as a player’s home environment can greatly influence certain outcomes (see: Coors Field). A foundational concept of sabermetrics is league/park adjusted statistics, which allow for an apples-to-apples comparison of players across different eras and ballparks. Valuing a player only matters if you can compare that value directly to others. Owners and general managers need to understand how potential additions stack up against their current roster—and, just as importantly, what those players are worth.
The easiest to understand are “+” stats, where 100 is league average. Notably, these stats are rate based and do not award volume. To understand how the formula works, let’s take a look at ERA+:
ERA+ = 100 × (lgERA / ERA) × Park Factor
Where Park Factor is a value that varies depending on how hitter- or pitcher-friendly a given ballpark is. For the 2024 season, Coors Field had the highest park factor at 112, while T-Mobile Park was the most pitcher-friendly at 91.
League and park adjusted stats are ideal for comparing players from different eras and teams on a level playing field. In 2019, amidst rumors baseballs had been modified to fly faster and further, Rafael Devers had a .916 OPS and 132 OPS+ in the very friendly confines of Fenway Park. In 2022, Pete Alonso had a lower OPS of .869 but a higher OPS+ of 146, meaning he was relatively better than Devers when adjusting for league and ballpark effects.
Why it matters: It helps predict how players will perform in new environments if traded or signed to a new team in free agency. Relative value is important for general managers to decide where to allocate their limited resources.
My favorite: OPS+ is the best balance of simplicity and comparative value out of any baseball statistic. It allows fans to compare players from dramatically different eras with relative ease. Some flaws are that it does not reward players for volume and is not influenced by defense or position played. For context, Aaron Judge (223) and Shohei Ohtani (190) led the league in OPS+ in 2024.
Level 4: Modern Sabermetrics
These stats are nerdy but powerful—harder to calculate, but better at measuring overall player value. Let’s start with Wins Above Replacement, or WAR. WAR is a counting statistic that measures a player’s value over the course of a season or career. It adjusts for the position they play, rewarding catchers and shortstops for the inherent difficulty of those positions while punishing first basemen and DHs for the ease of replacement. Role player = 1–2 WAR, all-star = 4–5 WAR, and MVP = 6+ WAR.
Another leading statistic in this category is wRC+, which is a rate stat that measures a player’s offensive contribution while adjusting for league and park factors. Its use case is very similar to OPS+, but with a more complex formula that is more accurate in quantifying offensive value.
A key pitching stat in this category is FIP (Fielding Independent Pitching), which measures what a player’s ERA would look like if the pitcher experienced league-average results on balls in play and timing. While a player may have a similar ERA and FIP, FIP is generally a stronger predictor of future performance.
FIP > ERA = “lucky” season
FIP < ERA = “unlucky” season
My advice: Don’t stress the formulas—focus on how these stats tell a story. They help explain why traditional stats might overrate or underrate a player. Other examples include:
DRS (Defensive Runs Saved): How many runs a defensive player prevents from occurring
xWOBA (Expected Weighted On-Base Average)
My favorite: WAR is a fantastic benchmark for performance over a given time, and can be used to compare 1923 Babe Ruth (14.7 WAR) and 2022 Shohei Ohtani (9.2 WAR). Pro tip—career WAR is the go-to statistic many baseball writers refer to when deciding who deserves to be immortalized at the Baseball Hall of Fame in Cooperstown.
Level 5: Statcast
In 2015, Major League Baseball was changed forever with the introduction of Statcast at all 30 ballparks. Statcast is a joint venture between data analytics companies to formulate data and statistics on behalf of MLB. Like any predictive algorithm, the output is only as good as the data you feed into it. Statistics such as catcher pop time, exit velocity, and sprint speed are now readily available and automatically calculated with high precision. While these are basic measurements, they can be combined to form compound statistics that can predict outcomes at a level never before seen in baseball.
These stats can be confusing, but don’t worry—there’s a solution. Baseball Savant compiles some of the most popular Statcast-driven stats into one-page visuals that measure a player’s abilities in relation to the rest of the league.
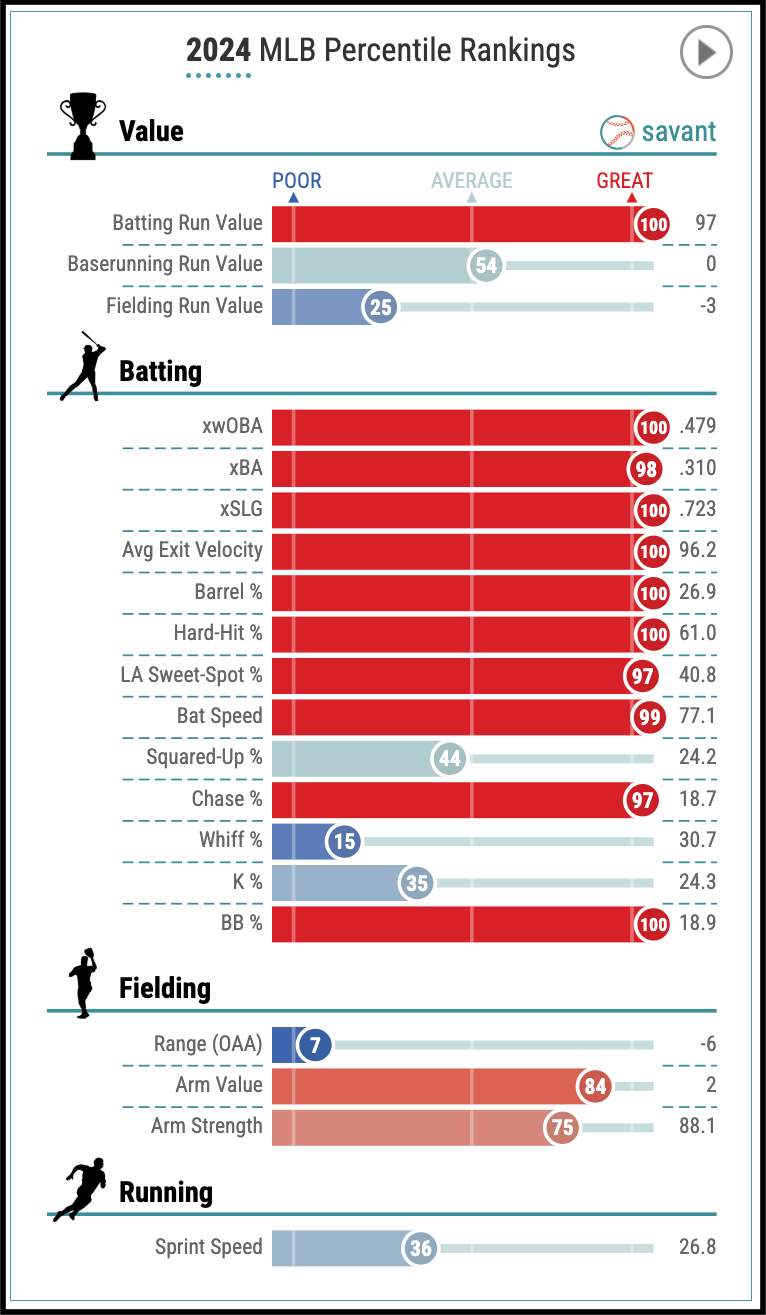
Unsurprisingly, the reigning MVP is in the 99th or 100th percentile in many important areas. We can see that he is below league average in fielding and sprint speed, which passes the eye test. The above numbers only scratch the surface of what’s possible with Statcast. Some examples:
Barrel: Batted-ball events with elite exit velocity and launch angle. Generally, exit velocity >98mph and launch angle of 26–30°. These produce a minimum .500 batting average and 1.500 slugging percentage.
OAA (Outs Above Average): Modern defensive stat that measures the likelihood of making an out. Rewards range, penalizes missed routine plays.
Spin Rate: Previously unmeasurable in live games. Statcast made it mainstream and crucial in pitch analysis.
My favorite: Basic speed measurements. They are simultaneously simple (e.g., exit velocity) and fun (e.g., 2022 Albert Pujols’ 1st percentile sprint speed—ouch).
Conclusion:
I know that was a lot of acronyms and numbers to throw your way—there’s definitely a lot to digest. If you're trying to determine relative player value, here’s a simple framework to guide your thinking:
Define your end goal. Are you trying to convince your Yankees fan friend that Shohei Ohtani (as a pitcher) is more valuable than Aaron Judge? Doing last-minute research for your fantasy baseball draft? Writing a Hall of Fame ballot? The more important or nuanced your objective is, the more research and advanced metrics you'll need to use.
Identify your point of comparison. It’s great to say that 2022 Shohei Ohtani was worth 9.2 WAR—but that number means nothing without context. (What is a win above replacement, anyway?)
Level the playing field. This is where park- and rate-adjusted stats come in. They allow for apples-to-apples comparisons and give your argument credibility. Ideally, you should use both counting and rate-based sabermetrics here.
Make it approachable. Even the most accurate, in-depth analysis won’t land if your audience feels alienated by dense jargon or complicated numbers. One of the core goals of good data analysis is to take complex ideas and communicate them clearly. Many people are visual learners, too—if that’s your audience, tools like the Foolish Baseball YouTube channel are a great example of data storytelling done right.
There are plenty of other sabermetric stats out there, but this post was meant to provide a high-level overview. Thanks for reading—and stay tuned for more soon!
Sources:
https://www.nytimes.com/athletic/4604060/2023/06/15/oakland-as-moneyball-michael-lewis-baseball/
https://www.fantasypros.com/sabermetrics-glossary/
https://baseballsavant.mlb.com/leaderboard/statcast-park-factors
https://library.fangraphs.com/misc/war/
https://library.fangraphs.com/offense/wrc/
https://library.fangraphs.com/pitching/fip/
https://www.mlb.com/glossary/advanced-stats/defensive-runs-saved
https://www.fangraphs.com/players/babe-ruth/1011327/stats?position=OF
https://www.fangraphs.com/players/shohei-ohtani/19755/stats?position=DH
https://baseballsavant.mlb.com/savant-player/aaron-judge-592450